
Introduction
Unlike waterfall, agile projects don't follow a predefined itemized scope of work. If you're unfamilar with this type of process, how can you know that your project is going well? There are several KPIs that can be used together to evaluate development projects: hours utilized, story points, feature completion, and qualitative feedback. Hours and story points are quantitative measures of how much time has been spent on your project, and how much time something is expected to take. These can be supplemented with the evaluation of feature completion and feedback collected from the client and ideally the product's users.
Project Updates
Fusionbox provides several different forms of reporting for client projects. We encourage feedback on the format and content of each of these reports, so they can evolve to meet each client's specific reporting needs. When new projects are being developed, Fusionbox provides a regular update that may include the following information:
-
Number of hours and percentage of timebox utilized
-
Indication that the project is on track, ahead of schedule, or at risk of going over budget
-
Items that are recently completed, in progress, or planned for the upcoming week/sprint
-
Tasks that require attention from the client
-
Link to a detailed hours log, with each entry including the date, team member, hours, and notes
-
Agenda items for the next team meeting
-
Charts detailing team velocity in hours, work remaining in backlog, etc.
These reports may be delivered at the completion of a sprint, or on a weekly basis, for example. They provide the team with context for how much time has been spent and what has been accomplished in that time. It draws attention to outstanding dependencies or items that have been stalled in the same status. These updates also provide a snapshot of the project for any team members that aren't monitoring the project board.
For longer projects, Fusionbox will provide a more detailed project update at important milestones. This will add budget analysis for time allocation and estimation accuracy (see below), as well as updated forecasting for the remaining budget and timeline based on the project's progress to date. This allows the team to maintain realistic expectations and make informed product desicions as development continues.
Charts!
Team Velocity
A team's velocity is a measure of hours spent or story points completed over time. When used with an estimated backlog, this can help predict when the project will be completed. The example below illustrates a projection of average hours utilized per week throughout the duration of a project, compared with the actual hours used. The projected velocity should be carefully calculated by the team's product lead, accounting for historical data, typical sprint cycles, holidays, planned vacation time, etc. This type of chart can show if a project is on track to meet a given deadline, but should always be supplemented with the context of completed work.
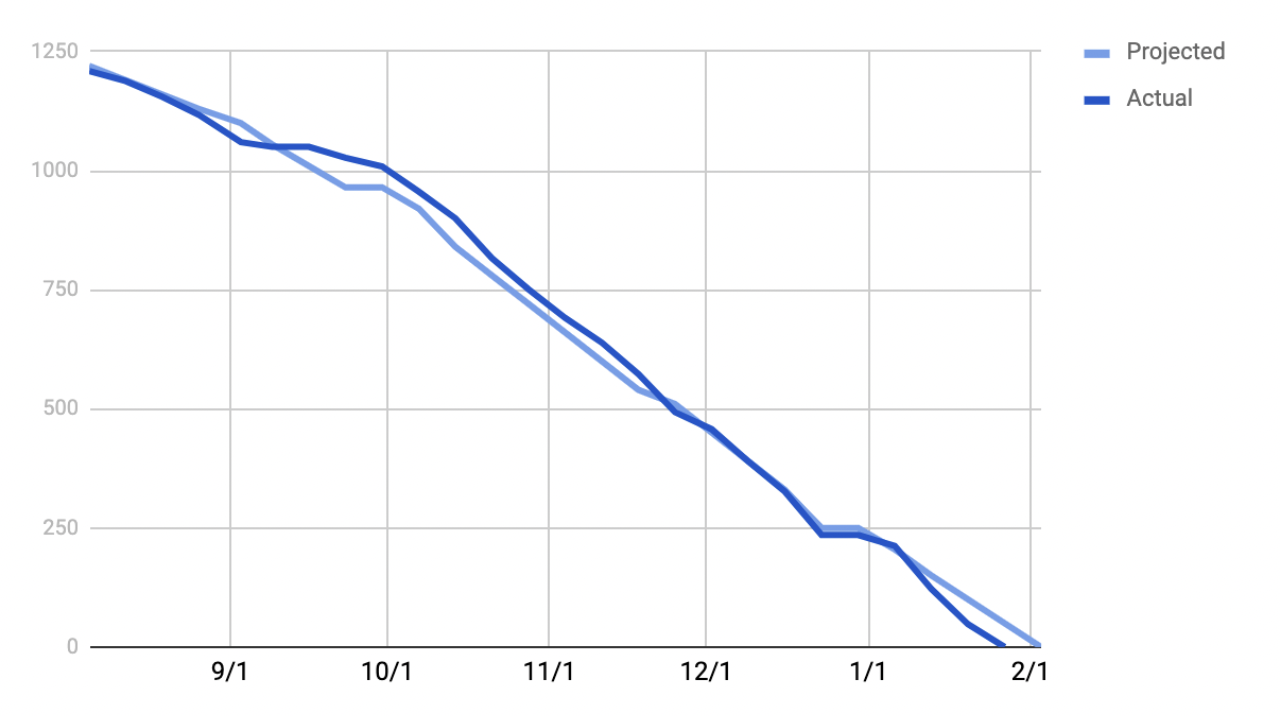
In this particular example, the team stayed fairly close to the predicted velocity and ended the project just a bit early. But without the context of completed work, it's impossible to know if the project was successful in delivering the anticipated value based on this chart alone.
Estimation Accuracy
Software projects often involve lots of estimation throughout the process. Teams estimate features and tasks in hours or points as they are added to the backlog. Since Fusionbox maintains detailed timesheet entries about each team member's time spent on those tasks, we can conduct analysis on our estimation accuracy and provide charts like the one below.
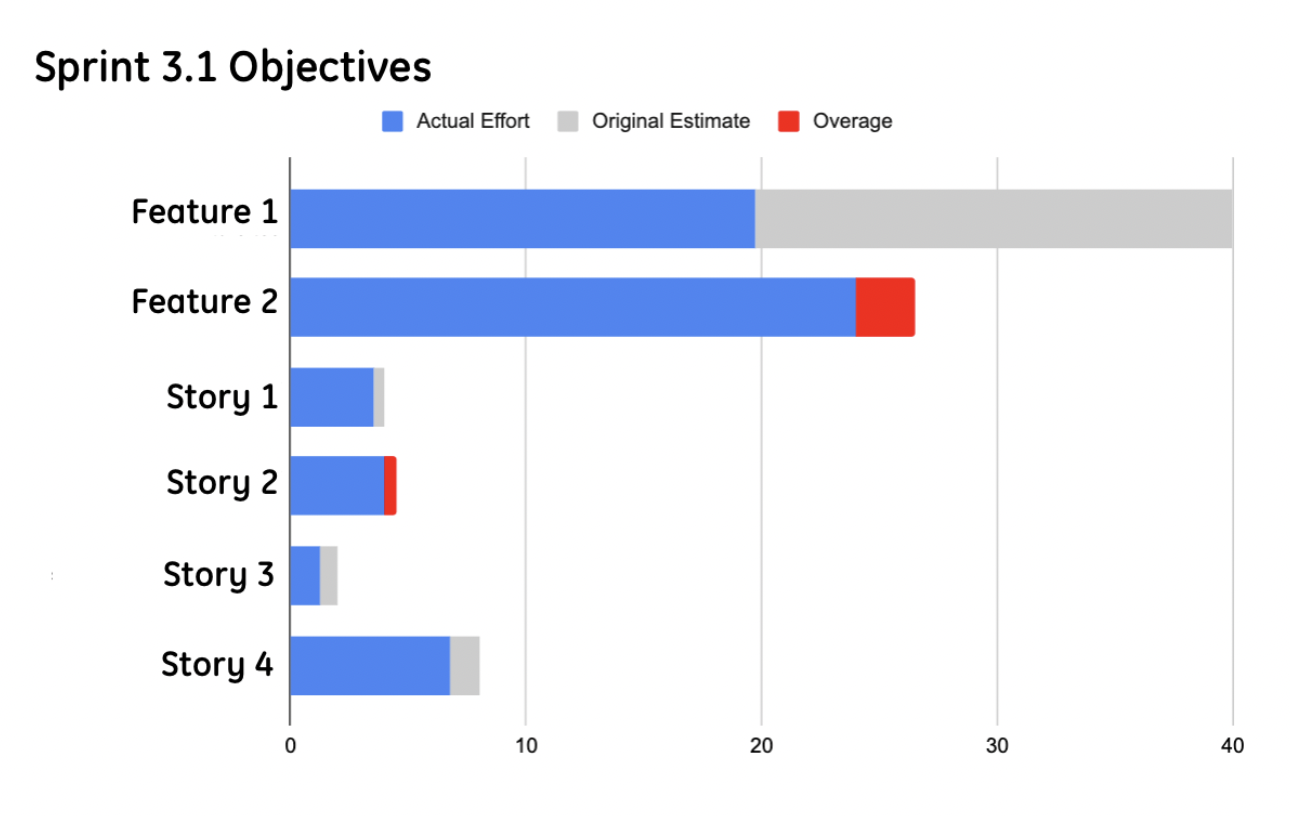
This example illustrates the time estimated for a variety of features and stories, and the time it actually took to complete those tasks. This type of reflection enables us to improve the accuracy of our estimates, illustrate unexpected complexity, and increase client understanding of budget consumption for a project. This type of analysis can also be done on the time allocation of different departments to the project, rather than time spent on individual features.
Time Allocation
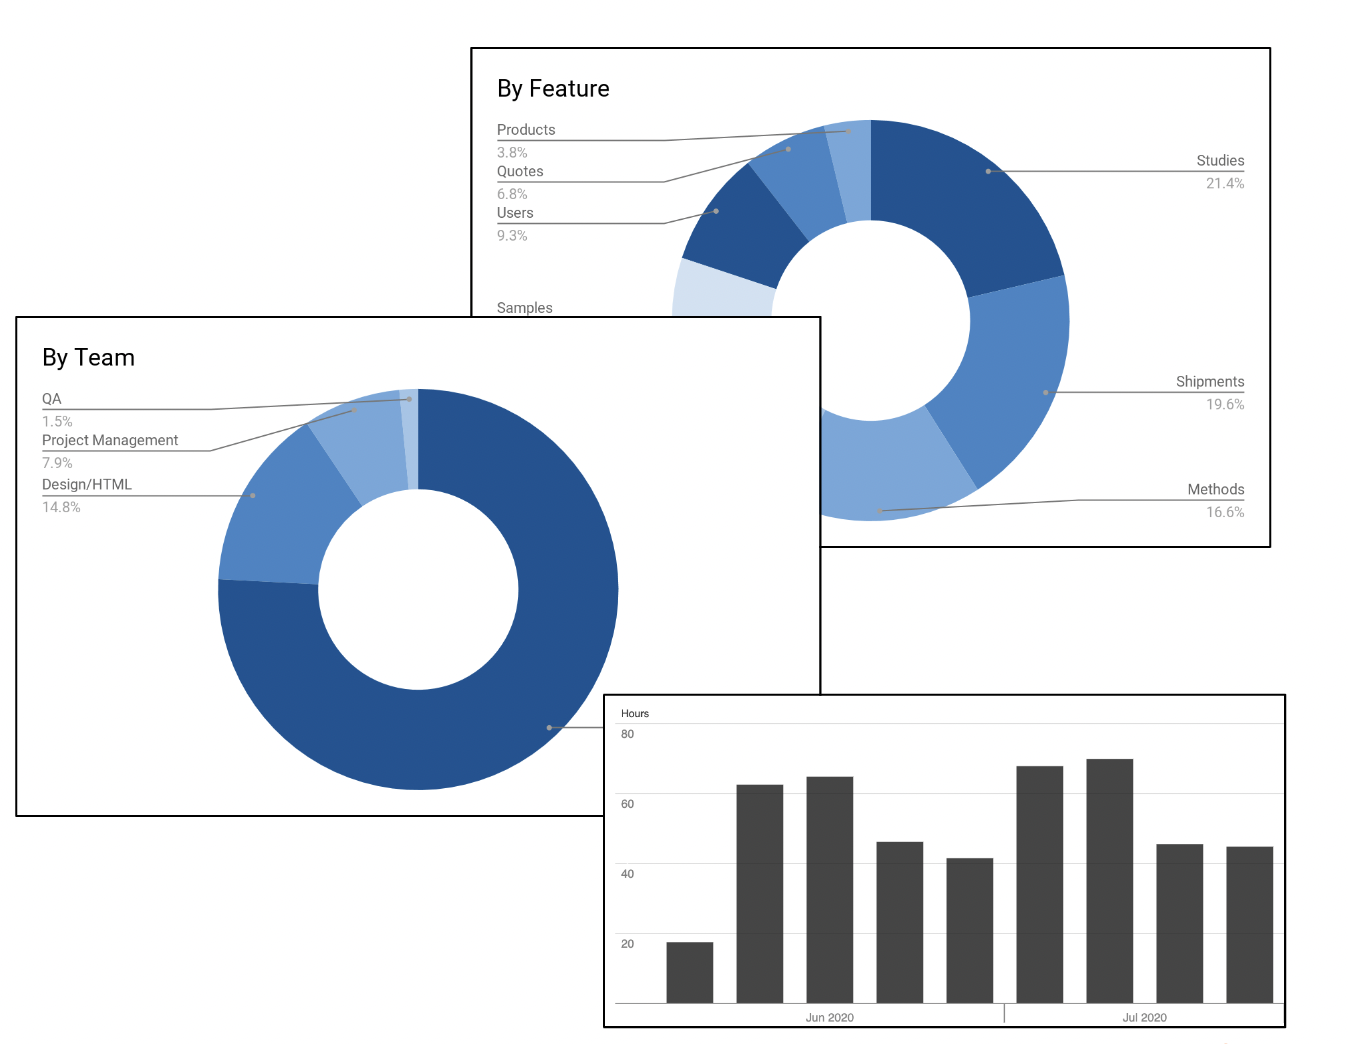
It can be helpful to review how the budget has been spent in various contexts to help understand how things are going. This might include viewing the total budget spent broken out by feature, department, or even by week. If you've spent 20% of your budget on a low-value feature, you might need to reprioritize your backlog. If the design team has logged 5% of the hours spent to date and you expect them to consume 10% of the overall budget, you might be able to get some of those wishlist items after all. And looking at the percentage of the budget spent each week can help you predict when the budget will run out.
Cumulative Flow Diagram
A cumulative flow diagram is the most complex visualization but provides the most information about an agile project. It plots the amount of work in your project, broken out by status - to do, in progress, qa, completed, etc.
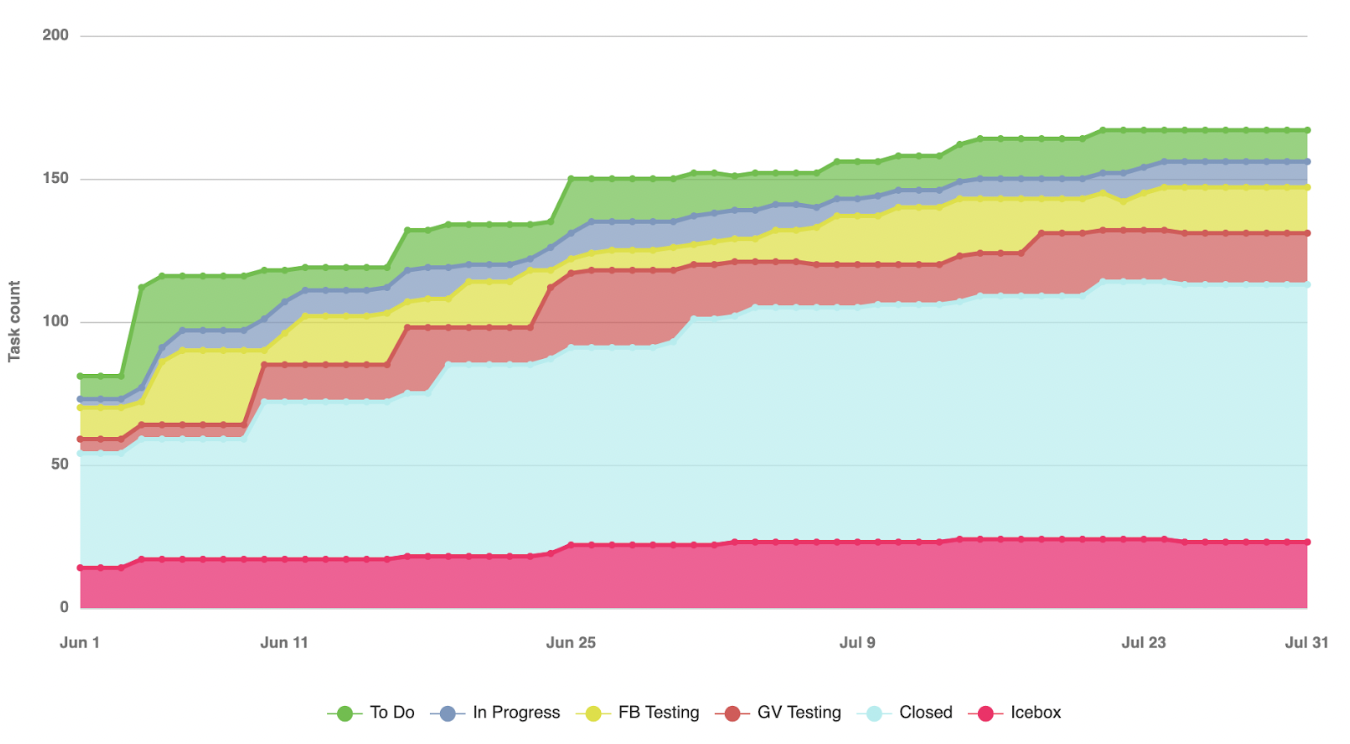
This allows you to see the team's velocity and completed work all in one chart. It also highlights any bottlenecks in the workflow and clearly shows if the backlog is significantly growing, so you can manage the project priorities effectively. However, this only works with a fully estimated backlog.
Product Roadmaps
After MVP, a product roadmap can be extremely helpful in planning future releases. In order for a roadmap to be successful, it should be simple, based on historical data, and limited to a relatively short time frame. Especially for software, a 5-year roadmap won't provide the flexibility to respond to user feedback. When done correctly, a roadmap can help predict feature releases, enable team collaboration in a visual format, and inform prioritization decisions for important calendar dates. Your roadmap should be a living document, updated to reflect and communicate your evolving product backlog.
Retrospectives
Retrospectives are an excellent opportunity to collect and address feedback from the product team, and should be done on a regular basis. Fusionbox conducts both internal retrospectives and joint retrospectives with our client teams. This allows everyone to reflect on what is and isn't working for the development process and brainstorm ideas for improving the working relationship. This feedback can then be distilled into a report to summarize what the team wants to address, how they plan to do it, and why it's important. Each retrospective item becomes an actionable ticket in the product backlog, so that feedback is never lost or filed away and forgotten.
Summary
There are plenty of options for monitoring the progress of your agile development project. An experienced product manager can help you collect and interpret all of this information so you can be confident in the success of your project, even without a list of predetermined deliverables for every milestone. Ready to embrace the freedome of making decisions at the last responsible moment? Let's talk about your project.