On July 1, 2019, Colorado Public Radio rebranded their ~8 year old music station, OpenAir, to Indie 102.3. Critics were skeptical that this would result in less diverse programming and a shift away from independent music towards more commerical choices- and I was skeptical of the critics. As far as I could tell, the programming seemed similar. Let's use Python to test this hypothesis!
As it turns out, Spotify has a REST API we can use. Per their documentation, we can search for tracks that fit a given query, and the returned track objects (if there are any), have a popularity field, which is described as
The value will be between 0 and 100, with 100 being the most popular.
The popularity of a track is a value between 0 and 100, with 100 being the most popular.
The popularity is calculated by algorithm and is based, in the most part,
on the total number of plays the track has had and how recent those plays are.
Now we need to figure out what tracks CPR has played in the last few months. Open up https://www.cpr.org/indie/playlist/ and you will observe that their site displays every song they've played today, and has a datepicker widget at the top. Open up chrome inspector and watch the Network tab when you change the datepicker to June 1, 2019: you will see a HTTP GET request to the following url:
https://playlist.cprnetwork.org/api/playlistCO/selectDate:MjAxOS0wNi0wMQ==
MjAxOS0wNi0wMQ== looks like base64: let's confirm. Fire up python in your shell:
1 2 3 4 | import base64
base64.b64decode("MjAxOS0wNi0wMQ==")
> b'2019-06-01'
|
Now, observe the server's response: It's a JSON list of objects formatted like so:
1 2 3 4 5 6 7 8 9 10 11 12 13 14 15 16 17 18 | {
album: "San Panino",
artist: "Knuckle Pups",
block_header: "",
event_block_active: 0,
icon_path: "",
image: "",
info_url_line_2: "",
info_url_line_3: "",
label: "Self",
label_num: "None",
line_1: "",
line_2: "",
line_3: "",
link_path: null,
start_time: "12:12 am",
title: "New Reckless",
}
|
A lot of this appears to be display metadata for CPR's site to interpret, but the important stuff is here: Artist name and song title. Let's go ahead and grab all the music played in the month before the rebrand, and the month following.
1 2 3 4 5 6 7 8 9 10 11 12 13 14 15 16 17 18 19 20 21 22 | import requests
from datetime import date
cpr_url = "https://playlist.cprnetwork.org/api/playlistCO/selectDate:{}"
# Build lists of dates in each month
june_dates = [date(2019, 6, i + 1) for i in range(0, 30)]
july_dates = [date(2019, 7, i + 1) for i in range(0, 31)]
def fetch_tracks(dates):
tracks_by_day = []
for d in dates:
# Format date according to the API's needs: 4 digit year, 2 digit month, 2 digit day, hyphenated.
formatted = d.strftime('%Y-%m-%d').encode('utf-8')
encoded = base64.b64encode(formatted).decode('utf-8')
# Append our base64 encoded date to the base url
url = cpr_url.format(str(encoded))
response = requests.get(url)
tracks_by_day.append(response.json())
return tracks_by_day
june_raw_tracks = fetch_tracks(june_dates)
july_raw_tracks = fetch_tracks(july_dates)
|
This will take a moment to run, but when it finishes, we will have one list of lists for each month. June will have 30 days, and July 31. Each member of the list is a list of tracks played on that day.
Now we need to try to figure out each track's popularity rating. For this, we'll need to hit Spotify's API per track. This is going to take a while: if you count the tracks played per month, we're looking at ~11,000 tracks per month. In order to hit Spotify's API, you will need a subscription. Log in to their developer console at https://developer.spotify.com/dashboard/applications and click "Create a Client ID". Fill out the form, and you will be granted a Client ID and Client Secret. Copy these down somewhere, and be sure not to share them.
Spotify has a handful of ways to authenticate with their API, the one best suited for this project, in my opinion, is the Client Credentials Flow, detailed here: https://developer.spotify.com/documentation/general/guides/authorization-guide/#client-credentials-flow
This is good for us because we don't need any access to user specific data: we're not messing with playlists or anything- we're just searching tracks. (But, here's an idea: with the right set of grants, we could make an application that runs nightly and builds a playlist of the previous day's radio play!)
To authenticate, we're going to make a request to the /token endpoint, which will grant us an access token good for an hour of fun. We'll then use that token to hit the /search endpoint.
1 2 3 4 5 6 7 8 9 10 11 12 13 14 15 | import requests
import base64
SPOTIFY_AUTH_URL = "https://accounts.spotify.com/api/token"
def get_api_token():
# Per documentation, the Authorization header should read: "Basic <base64 encoded client_id:client_secret>""
auth_string = f'{SPOTIFY_CLIENT_ID}:{SPOTIFY_CLIENT_SECRET}'.encode('utf-8')
auth_encoded = base64.b64encode(auth_string).decode('utf-8')
response = requests.post(SPOTIFY_AUTH_URL, data={
'grant_type': 'client_credentials'
}, headers = {
'Authorization': 'Basic {}'.format(auth_encoded)
})
return response.json()['access_token']
|
Now, we'll query the search endpoint. Per the documentation, we must specify the desired response type type, and submit a query q.
Our type will be track, and we will dynamically build q like so:
q=artist:{artist_name} track:{song_title}
1 2 3 4 5 6 7 8 9 10 11 | import requests
spotify_url = "https://api.spotify.com/v1/search?"
def spotify_search(track, token):
search_string = f"type=track&q=artist:{track['artist']} track:{track['title']}"
headers = {
"Content-Type": "application/json",
"Authorization": "Bearer {}".format(token)
}
response = requests.get(spotify_url + search_string, headers=headers)
return response.json()
|
So now, we can go forth and search: just provide this function one of our many track objects and a valid api token!
So let's loop over a month at a time and get the popularity of each track in each day.
1 2 3 4 5 6 7 8 9 10 11 12 13 14 | def append_spotify_popularity(month):
errors = []
token = get_api_token()
for day in month:
for track in day:
result = spotify_search(track, token)
try:
track['popularity'] = result['tracks']['items'][0]['popularity']
except (IndexError, KeyError) as e:
errors.append({'track': track, 'error': e})
return month, errors
june_tracks, june_error = append_spotify_popularity(june_raw_tracks)
july_tracks, july_error = append_spotify_popularity(july_raw_tracks)
|
Notice the error list: We're going to have some tracks for which spotify's search will return no results. Sometimes this is due to misspelling titles, but there are also a fair number where the CPR provided song title contains something like (Live at CPR Studios), and Spotify doesn't have those exact tracks, so we will skip them. Data is messy, we could go down a near infinite rabbit hole trying to clean this up, but each month has roughly the same proportion of errors so we will move along for now.
Using matplotlib, we can plot this data on a histogram to get a visual sense of whether or not there's been a distribution shift:
1 2 3 4 5 6 7 8 9 10 11 12 13 14 15 16 17 18 19 20 21 22 | from matplotlib import pyplot
def draw_histogram(june, july):
p1 = []
p2 = []
for day in june:
for track in day:
p = track.get('popularity', False)
if p:
p1.append(p)
for day in july:
for track in day:
p = track.get('popularity', False)
if p:
p2.append(p)
pyplot.hist([p1,p2], bins=20, label=["June", "July"])
pyplot.ylabel('Track Count')
pyplot.xlabel('Popularity')
pyplot.legend(prop={'size': 10})
pyplot.show()
draw_histogram(june_tracks, july_tracks)
|
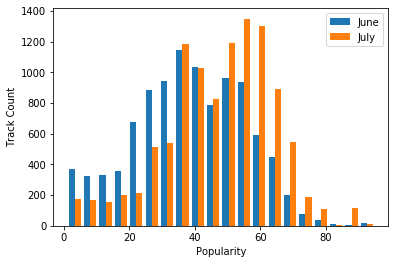
From this, we can see there does appear to be a shift! July has considerabily more plays in the 50-60 popularity range, vs Junes higher count in the 20-40 range.
Now, I'm a bit skeptical, because per Spotify's documentation, more recent plays matter more when calculating popularity. If the station's choice in music has not changed, we might observe that music played a month ago is simply less popular than music playing today. If that's the case, we'd probably expect to see a sloping increase in popularity running from two months ago to now: so let's chart daily averages and see if we observe this.
1 2 3 4 5 6 7 8 9 10 11 12 13 14 15 16 17 18 19 20 21 22 23 24 | import numpy as np
def get_daily_averages(month):
avgs = []
for day in month:
popularity_list = [track['popularity'] for track in day if track.get('popularity', None) is not None]
avgs.append(sum(popularity_list) / len(popularity_list))
return avgs
july_avgs = get_daily_averages(july_tracks)
june_avgs = get_daily_averages(june_tracks)
def get_medians(days):
medians = []
for tracks in days:
arr = []
for t in tracks:
if t.get('popularity', None):
arr.append(t['popularity'])
medians.append(np.median(arr))
return medians
june_medians = get_medians(june_tracks)
july_medians = get_medians(july_tracks)
|
Now we have a list of daily means and medians per month: let's chart them and see what we find!
1 2 3 4 5 6 7 8 9 10 11 12 13 14 15 16 17 | from matplotlib import pyplot
from matplotlib.dates import WEEKLY, DateFormatter
fig, ax = pyplot.subplots()
# Bigify the chart so its more readable
fig.set_figwidth(10)
fig.set_figheight(5)
# Format the dates
formatter = DateFormatter('%m/%d/%y')
ax.xaxis.set_major_formatter(formatter)
ax.xaxis.set_tick_params(rotation=30, labelsize=10)
# Draw the lines
pyplot.plot_date(june_dates + july_dates, june_avgs + july_avgs, xdate=True, fmt="-", label="Mean Popularity/Day")
pyplot.plot_date(june_dates + july_dates, june_medians + july_medians, xdate=True, fmt="--", label="Median Popularity/Day")
# Add legend
pyplot.legend(prop={'size': 10})
pyplot.show()
|
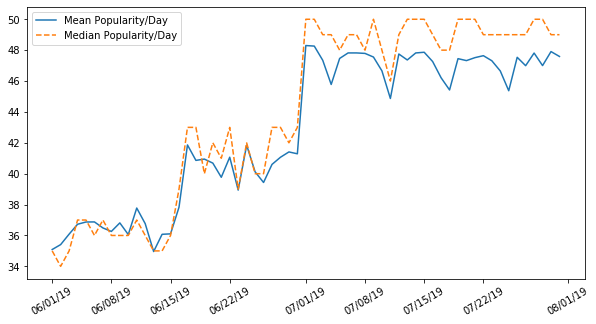
So it seems on July 1 there is a visible spike in daily averages: we go from hovering in the high 30s to low 40s to mid-high 40s overnight, the same day the station rebranded. There's a ton of questions we can ask of this data and get answers with Python: if you'd like to do any of your own analysis, the source code (and the data!) is available at https://github.com/SzySteve/OpenAir.
Fusionbox is a custom Python & Django development company, with a focus on secure, well-architected projects. Contact us if you would like to discuss your project.